%20--%3e%3ccircle%20cx='20'%20cy='75'%20r='10'%20class='chart-color'/%3e%3ccircle%20cx='40'%20cy='50'%20r='10'%20class='chart-color'/%3e%3ccircle%20cx='65'%20cy='63'%20r='10'%20class='chart-color'/%3e%3ccircle%20cx='87'%20cy='35'%20r='10'%20class='chart-color'/%3e%3c/svg%3e)
Blog
Building a Scalable System (Part 2)
The Journey Is More Exciting Than the Destination
The destination, in this case, is the conclusion that using consumer SSDs for sustained and consistent performance probably isn’t a wise thing to do.
Following on from Part 1, we built a system for conferences that allowed attendees to view conference talks, like certain talks, and show interest in others. The key use case of the system is allowing users to load their home page, which highlights all of the talks they've liked and expressed interest in.
A larger conference might have around one hundred talks, but we wanted to see how the system would cope if this number was increased by two orders of magnitude. To simulate this, we generated a bootstrap script that would randomly generate likes from users for talks. The pseudocode looked like this:
for each user:
        for each talk:
            randomly 'like' a talk
We used this to generate approximately 30 million entries, which were then batched up and inserted into the user_event_likes table - a simple mapping of a user GUID to an event GUID.
During the execution of this bootstrapping process, something peculiar began to happen: after about 100 batches (of 300), the insert times started to double.
This article details the process of figuring out why that might be the case.
CPU Flame Graph
CPU flame graphs help identify performance bottlenecks. They are visual representations of where the CPU is spending most of its time. Brendan Gregg did a fantastic talk on them at USENIX '17 (Visualizing Performance with Flame Graphs), so I won't attempt to outdo him here. The core concept is this: the wider the block, the more CPU samples have been collected there, and therefore, the more time has been spent in that code path.
One tool for generating CPU flame graphs is async-profiler, which can be run as follows:
$ ./asprof -e cpu -d 30 -f cpu_profile.html PID
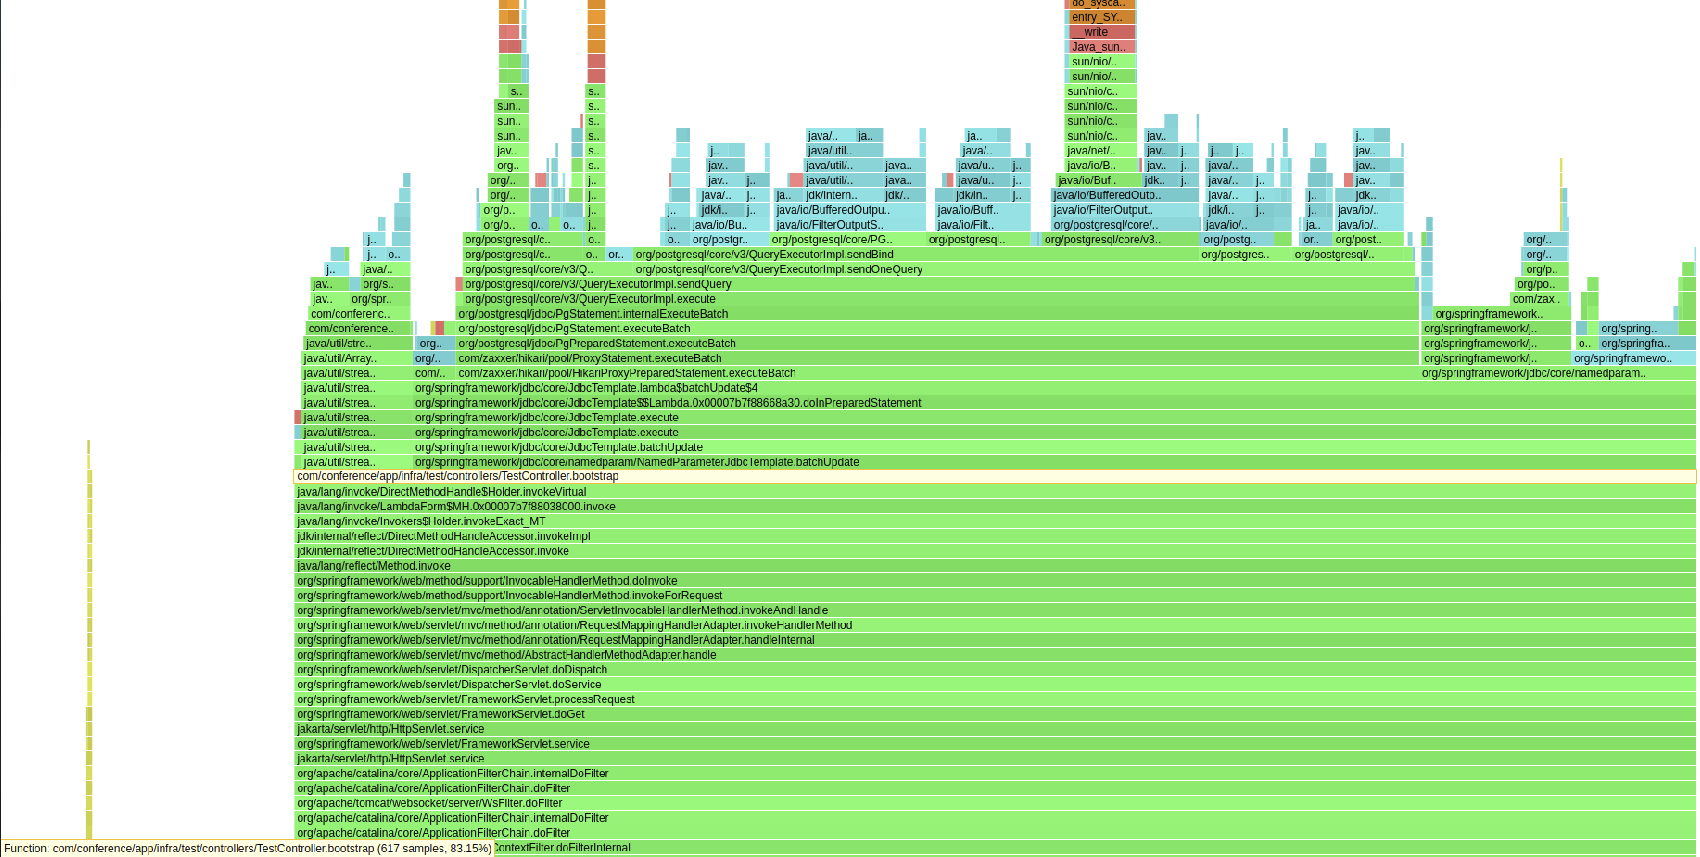
Below is a flame graph taken from my system before the batched inserts begin to slow down. The highlighted line in light yellow shows the pertinent bootstap method. As you can see, some of the time is spent doing work in java streams and the majority of the work is spent in jdbc's batch update. The graph shows that our code doesn't add much overhead at all during healthy execution.
The next flame graph is taken after the batch inserts begin to slow down. As can be seen, not much changes.
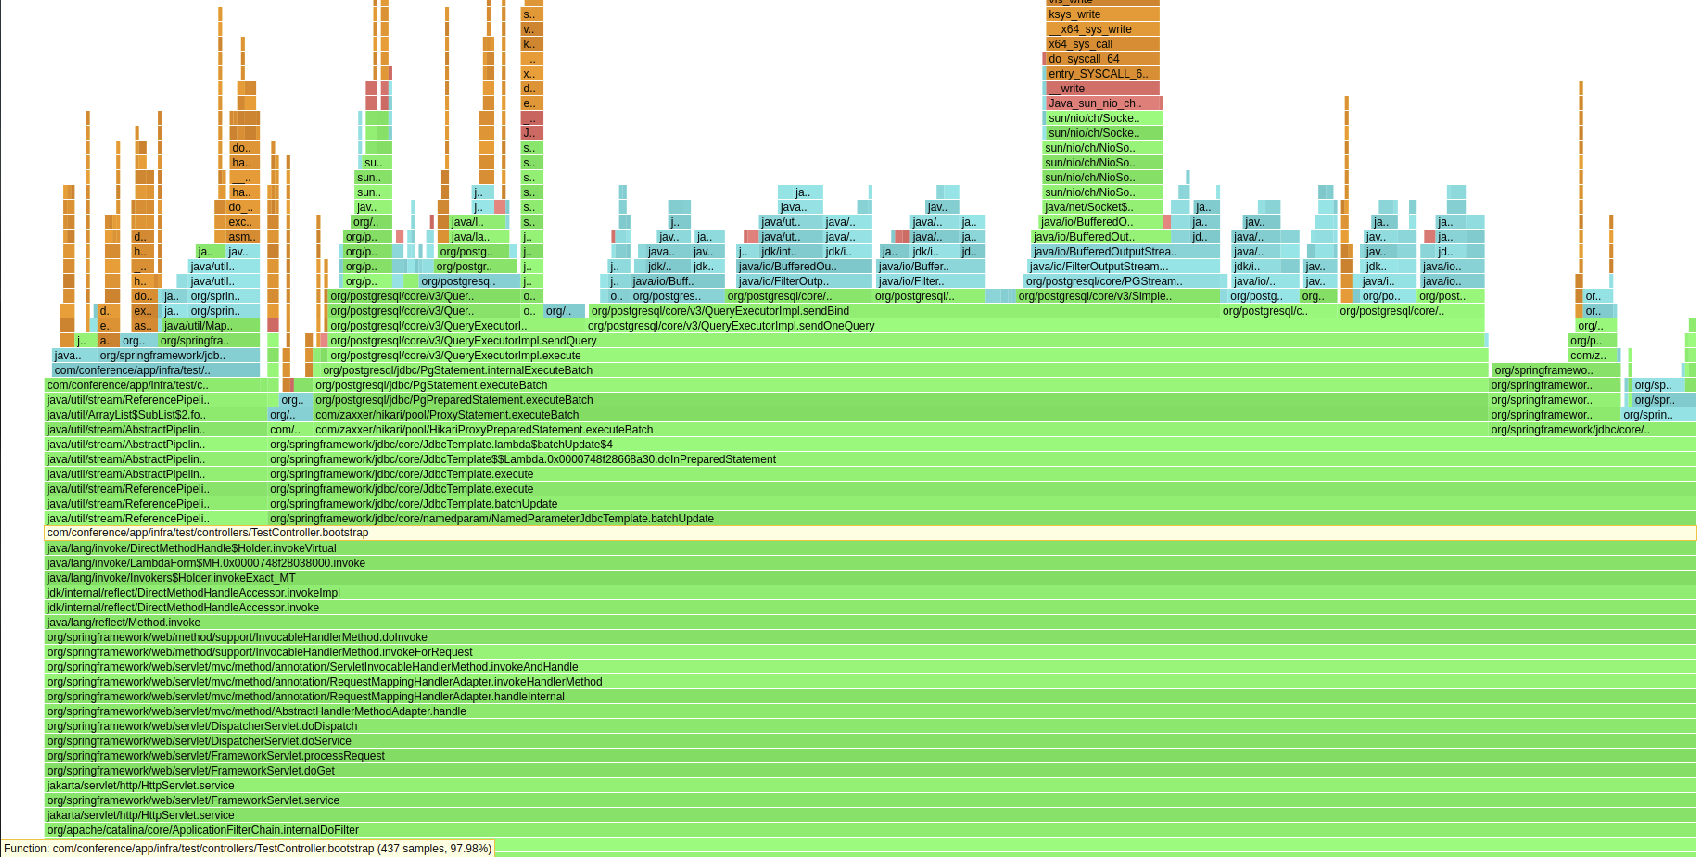
These two flame graphs suggest that our code is not causing the slowdown, so we need to move onto Postgres next.
WAL Pressure
I ensured the table was as simple as possible - I removed indexes and unique constraints, as these can lead to slowdowns over time. However, the issue persisted.
I then ran iostat to look for anything unusual. iostat is a great tool for monitoring system I/O; it provides statistics on read/write throughput, queue lengths, and service times. I used it to record disk statistics during both "healthy" and "unhealthy" operation, and it showed some interesting data. %iowait almost doubled, and w_await increased almost sixfold. Clearly, something strange was happening.
After some back and forth with ChatGPT, I tried recreating the table as an unlogged table - and this fixed the issue. I tried turning fsync off - this also solved the issue.
Given that the table had no indexes or constraints and was only being written to, the only major remaining factor that could cause heavy I/O was the WAL (Write-Ahead Logging). Creating an unlogged table bypasses the WAL, and turning off fsync prevents PostgreSQL from forcing data to disk immediately. Both changes led me to strongly suspect that the issue was not PostgreSQL itself, but rather my SSD.
I wanted to run one more test. I used eBPF (Extended Berkeley Packet Filter) to measure actual fsync times during both healthy and unhealthy states.
eBPF is an extremely powerful tool that allows you to run programs inside the Linux kernel. It lets you hook into kernel events and perform operations on them. In my case, I wanted to hook into the sys_enter_fsync and sys_exit_fsync events. For more details, again I recommend Brendan Gregg’s excellent talk, Give Me 15 Minutes and I’ll Change Your View of Linux Tracing (available on YouTube).
I used the following script to generate a histogram of fsync durations:
#!/usr/bin/env bpftrace

    tracepoint:syscalls:sys_enter_fsync
    {
        @start[tid] = nsecs;
    }

    tracepoint:syscalls:sys_exit_fsync
    /@start[tid]/
    {
        $elapsed = (nsecs - @start[tid]) / 1000000;
        @[comm] = hist($elapsed);
        delete(@start[tid]);
    }

    interval:s:15
    {
        clear(@start);
        print(@);
        clear(@);
    }
This script generated the following two histograms:
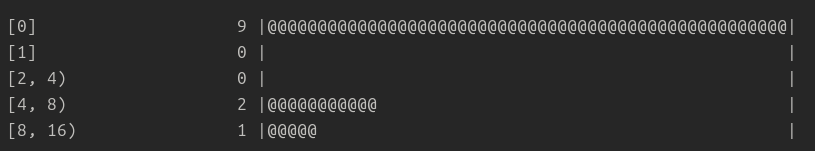
The healthy histogram above shows that the majority (75%) of fsync requests complete within 1ms
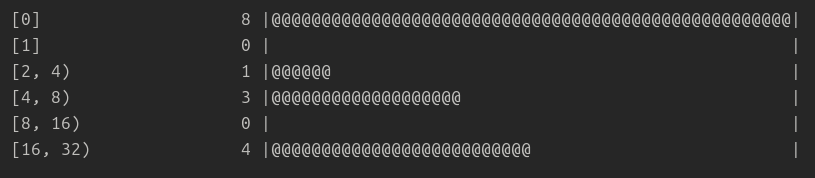
The unhealthy histogram above shows a dramatic slowdown, with only 50% of fsync requests completing within 1 ms. What's worse is that the tail has shifted, with 25% of requests taking between 16 and 32 milliseconds. Such a slowdown can have quite a dramatic ripple effect throughout the system.
So, it seemed that my SSD was indeed the root cause. To confirm this, I attempted to reproduce the issue on AWS. I spun up a large EC2 instance and re-ran the test - but I was unable to reproduce the slowdown.
Hardly surprising: my five-year-old, well-used Dell laptop might be the culprit. Still, I wanted to know exactly why. What could be causing my SSD to slow down so dramatically?
I dug into the specs of my SSD - which were annoyingly difficult to obtain, as the laptop invoice didn’t specify anything other than “1TB SSD.” After further investigation, I found the exact model and discovered that it has 1 GB of internal DRAM cache. Its write performance is rated at around 2,000–2,500 MB/s initially, but drops to ~1,200–1,400 MB/s once the DRAM cache is full.
This slowdown matched exactly what I was seeing.
For a final test, I monitored the size of the data on disk at the point in time when the slowdown began. I let the test run until the slowdown started and then killed it. Sure enough, the size of the data directory was a little over 1 GB - implying that once the internal cache filled up, fsync operations began to slow significantly.
Conclusion
Consumer SSDs are probably not the best choice for sustained performance. That may seem obvious in hindsight, but as I said, this article was more about the journey than the destination.